Knowledge
Our knowledge base :)
Project maintained by teamfcm Hosted on GitHub Pages — Theme by mattgraham
Home
State Chart Diagram
This diagram describes different states of a component in a system. As Statechart diagram defines the states, it is used to model the lifetime of a object
Purpose
Statechart diagram is one of the five UML diagrams used to model the dynamic nature of a system. They define different states of an object during its lifetime and these states are changed by events. Statechart diagrams are useful to model the reactive systems. Reactive systems can be defined as a system that responds to external or internal events.
Statechart diagram describes the flow of control from one state to another state. States are defined as a condition in which an object exists and it changes when some event is triggered. The most important purpose of Statechart diagram is to model lifetime of an object from creation to termination.
How to draw it
Statechart diagram is used to describe the states of different objects in its life cycle. Emphasis is placed on the state changes upon some internal or external events.
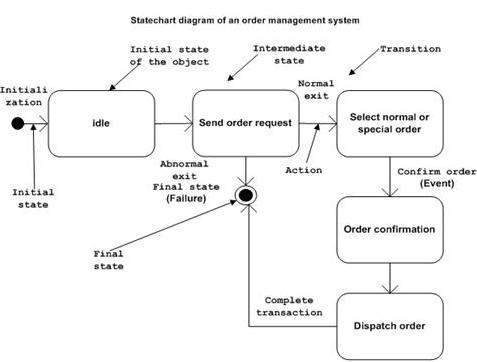
During the life cycle of an object (here order object) it goes through the following states and there may be some abnormal exits. This abnormal exit may occur due to some problem in the system. When the entire life cycle is complete, it is considered as a complete transaction as shown in the following figure. The initial and final state of an object is also shown in the following figure.